Introduction and Summary
The “Rise of the Rest” has become a common phrase used to describe the emergence of high-value entrepreneurship clusters in areas outside of the well-known coastal startup hubs such as San Francisco, Silicon Valley, Boston, and New York. The concept has been championed by famed entrepreneur and investor Steve Case, who has been instrumental in elevating entrepreneurship in communities throughout the United States.
Brad Feld, an entrepreneur and venture capitalist based in Boulder, Colorado, has a well-earned reputation for successfully investing in startups outside of Silicon Valley. Feld has also been a central figure behind Boulder’s emergence as a global startup hub—unusual for a city of its small size. His 2012 book, Startup Communities, is considered widely to be the definitive guide for how to build a vibrant startup ecosystem in cities almost anywhere.
In 2015, to partially test these ideas, I analyzed the geographic distribution of a subset of early-stage startups focused on high-growth—those raising venture capital funding. I restricted my analysis to the initial round of venture investment to hone-in on the companies most associated with starting up. My analysis of these “first financings” supported Brad’s and Steve’s theses by demonstrating that more early-stage companies from more U.S. metropolitan areas were being backed by venture capitalists.
But, is this still true?
That’s the question I’ll attempt to answer today with the benefit of three additional years of data to examine. Here are the main takeaways from my analysis:
- After a stellar five-year period of expansion, a sharp contraction in the number of startups raising a first round of venture capital has occurred the last three years—falling to 2,496 first financings in 2017 from a peak of 3,465 such deals in 2014, for a decline of 28 percent. It previously rose 155 percent over the five years between 2009 and 2014, up from 1,360 deals.
- This contraction has been geographically widespread. Fewer metro areas had a startup that raised a first round of venture funding and those that did had a smaller number of them. More than three-quarters of U.S. metropolitan areas had either no activity or declining activity in first financings between 2013-14 and 2016-17 (for the metro-level analysis, data are pooled into two-year periods to reduce year-to-year noisiness).
- First financings are still highly concentrated among a small number of cities. In 2016-17, five metros captured 54 percent of all U.S. first financings and ten metro areas accounted for 68 percent. That represents a slight expansion from 2009-10, when those same figures were, respectively, 52 percent and 65 percent.
- But, a number of startup communities continue to expand—including Boulder, Columbus, Indianapolis, Charlotte, Denver, and Durham-Chapel Hill. Key metros with relative rises (stable or slight declines during the period of sharp contraction overall) include Madison, San Diego, Pittsburgh, Raleigh, Houston, Baltimore, Seattle, Ann Arbor, Honolulu, Philadelphia, and Santa Barbara, among others.
- The longer arc tells a more positive story. Despite of a sharp decline after 2014, the number of startups receiving a first round of venture capital in 2017 was still 84 percent higher than in 2009. This longer-term expansion has been geographically widespread—38 percent of metros had more first financings in 2016-17 compared with 2009-10, 7 percent had the same number in both periods and 16 percent had fewer such deals (the remaining 38 percent had no deals in both periods).
So, are startup hubs rising in America? Evidence points in both directions. More early-stage startups in more metro areas are getting funded compared with eight years ago. But, there has also been a contraction in that growth the last few years. A plurality of metros participated in that national decline and the leading startup hubs still garner most first financings—even slightly expanding their share. While a rising tide may be lifting more boats, it appears to be lifting the biggest boats the most.
Reasonable people can interpret these data points differently, but I still believe the story is a positive one—more startups in more cities are accessing venture capital compared with a decade ago, a brief period of over-exuberance is moderating, and the early-stage funding market seems to be moving toward a more stable yet geographically inclusive path forward. I do believe that a rising tide of startup communities in America is underway, but that statement is not boundless—there is critical nuance.
The data are a stark reminder that startup communities take time to develop, that progress will be non-linear, and that the scope could be narrower than many would hope for. History suggests that the establishment of startup hubs must be thought of in terms of decades, not years, and there are limits to the number of cities that will ultimately emerge. It is still being determined which those will be, but the overall trend points to there being more of them.
Finally, this analysis answers many questions but raises some additional ones—including the extent to which companies in potentially emerging startup hubs are maturing beyond first financings to raise follow-on rounds of investment or achieve successful “exits” (e.g. acquisition, IPO); where these within-U.S. patterns fit among the broader global context; and the extent to which patterns observed in the last decade are truly indicative of a new normal or a blip on the radar. I look forward to tackling each of these in future work.
Startup Capital Reverses
We begin by looking at venture capital deal trends nationally. The chart below shows the number of venture capital deals in the United States annually between 2009 and 2017 by round number (rounds are sequenced by number as companies raise additional capital).
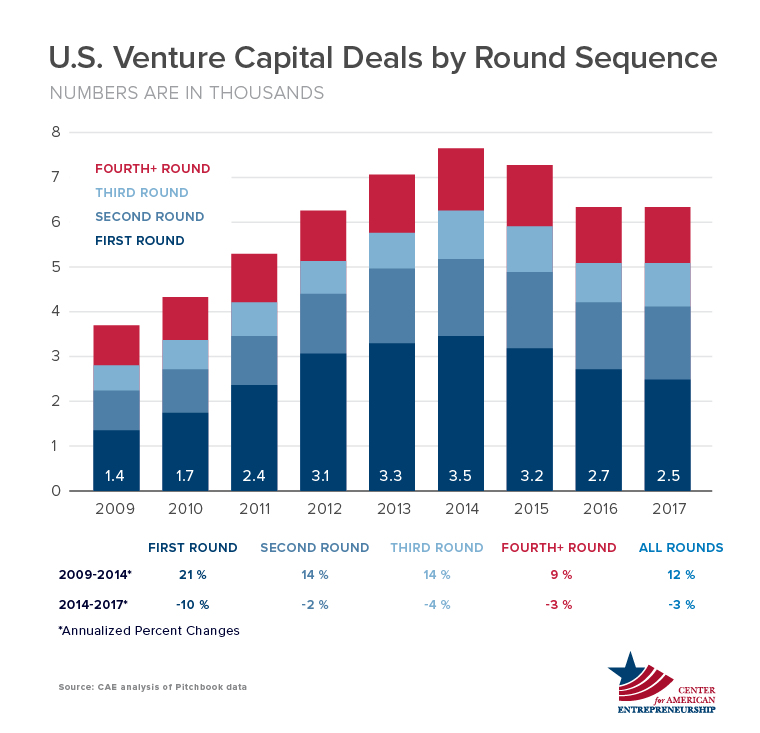
The venture capital market experienced substantial growth across the round sequences from 2009 to 2014, increasing from 3,695 total deals in 2009 to 7,656 by 2014—that’s a gain of 107 percent, or 16 percent per year on a compound basis. First round financings were the single largest contributor to the total trend, both by way of size (it is the largest among the four groups) and growth (it grew the most in percentage terms too).
After 2014, deals across each round sequence fell, dropping to 6,331 total deals by 2017, for a decline of 17 percent (or 6 percent on an annualized basis). The largest drop came from first round financings, which declined by 28 percent over the three-year period (or 10 percent on an annualized basis). This was by far the largest decline of any group.
A Geographically Widespread Decline
So, to what extent has the national decline in first financings been shared among metro areas around the country?
The chart below shows the distribution of first financings for each U.S. metropolitan area during three two-year periods: 2009-10, 2013-14, and 2016-17 (for the metro-level analysis I grouped the data into two-year periods to smooth noisiness in deal activity from year-to-year). Each bar shows the share of total metropolitan areas (vertical axis) along with the corresponding number of first financings (horizontal axis) during each period (bar colors). The bars for each period (colors) sum to 100 percent.
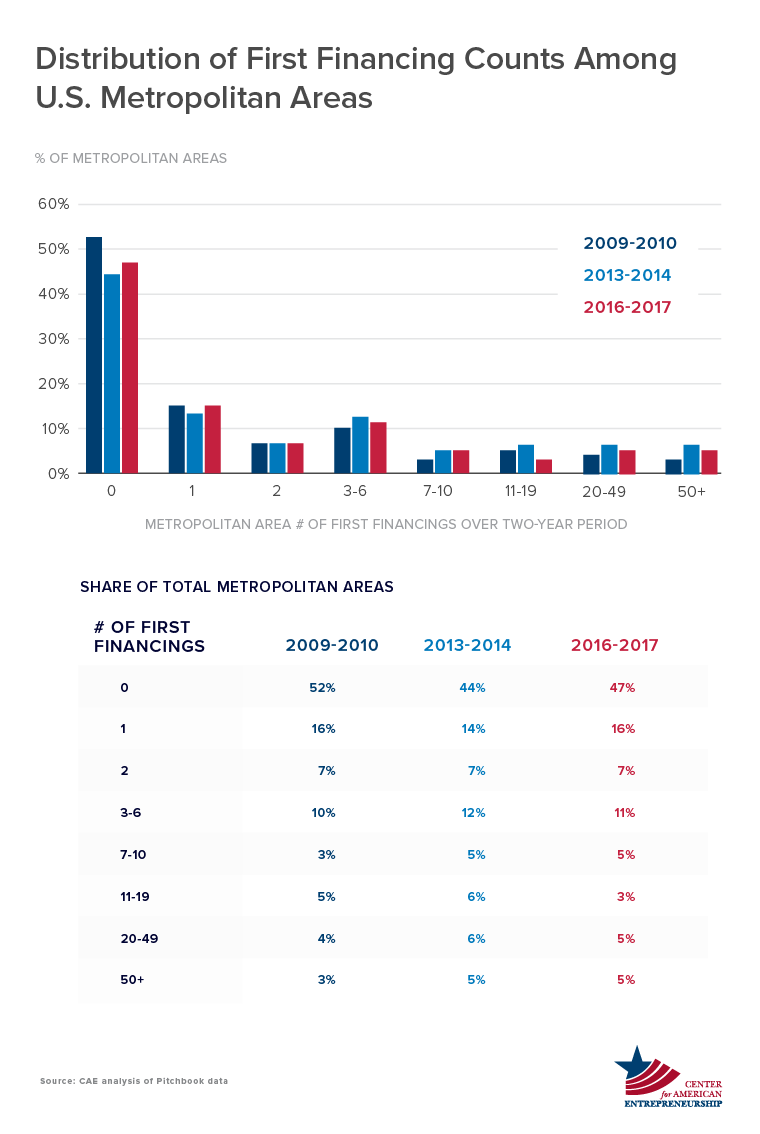
Let’s start with the changes between 2009-10 and 2013-14. The number of metro areas that received zero first rounds of venture capital plummeted from 52 percent in 2009-10 to 44 percent by 2013-14. All but one of the additional deal count groups—the lowest—saw increasing shares of first financings. Said differently, 68 percent of metro areas had fewer than one deal per year on average in 2009-10, a share that fell to 58 percent by 2013-14.
Between 2013-14 and 2016-17, there was a reversing of the trend—not a total return to where things were before, but a widespread reduction across many metropolitan areas. The share of metros with no companies receiving a first round of venture capital ticked up 3 percentage points to 47 percent. Those with zero or one deal over the two-year period increased from 58 percent in 2013-14 to 63 percent in 2016-17. Each group, with the exception of the lowest number of deals, saw share declines.
Another way of looking at this is by tabulating the number of cities that grew, that held steady, or that declined. The figure below does that (in addition to including a fourth category of cities that had no deals in both the beginning and ending of a period).
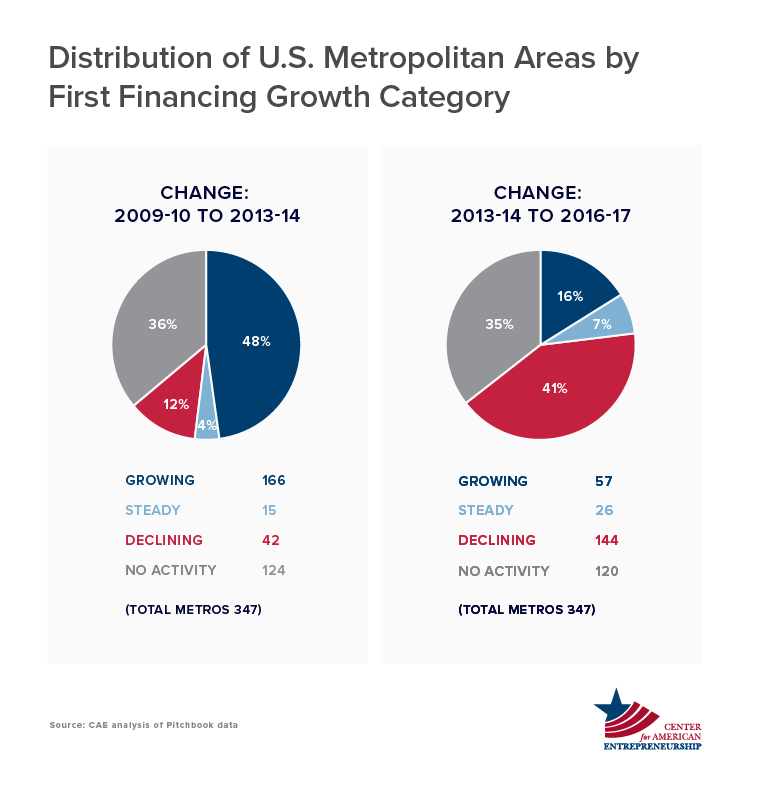
The figure shows a remarkable contrast between the two periods. Between 2009-10 and 2013-14, nearly half of all metros—48 percent—saw an increase in the number of first financings. Four percent had deals hold steady between the two periods, 12 percent had declining numbers, and 36 percent had no activity in both the base and ending years.
Compare that with the second period. Just 16 percent of metros increased the number of first financings between 2013-14 and 2016-17, for a 32-percentage point drop. Another 7 percent held even, while 41 percent had a decline in first financings—or a 29-percentage point increase from the earlier period. Another 35 percent had no deals in both periods.
Where Startup Capital Is (Relatively) Rising
Despite the widespread decline in first financings, a number of metros continue to rise, and many more held steady or declined only slightly. Given the substantial decline in first financings overall, the ability to more or less retain momentum should also be viewed favorably. The figure here shows the combined set of those two groups of metros—the absolute risers and those that are relatively rising.
The absolute risers are those metros that increased (or maintained) the number of first financings between the first two periods (2009-10 to 2013-14) and continued to increase first financings between the second two periods (2013-14 to 2016-17). The relative risers are the metros that increased first financings rapidly in the first period and either held flat or fell slightly in the second period.
The metro areas are sorted by their contribution to the change in first financings nationally (a function of size and growth) between 2013-14 and 2016-17. Metros with a small number of deals have been filtered-out here (but are detailed in the Appendix).
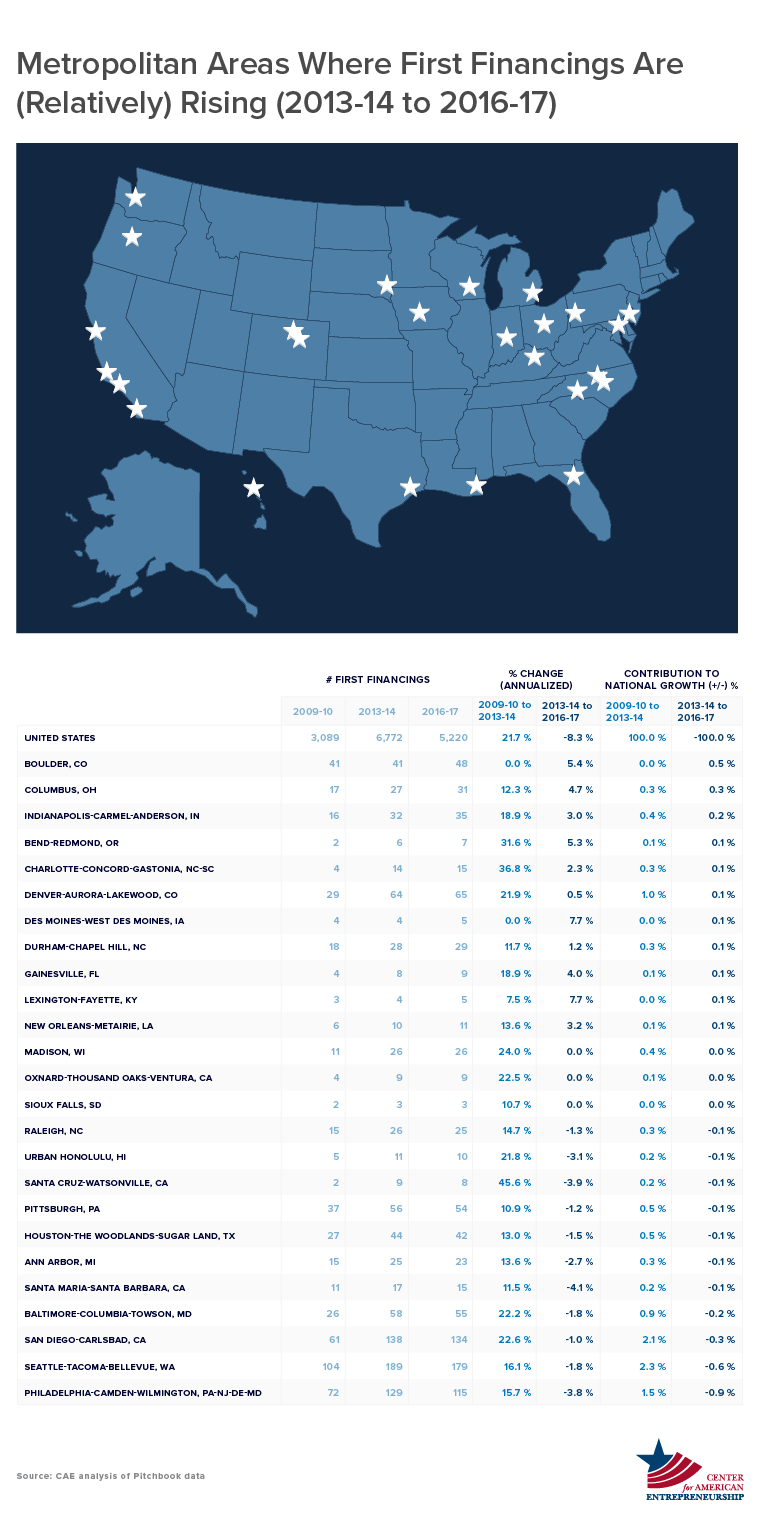
Leading the way is Boulder, which at 48 deals in 2016-17 was the 18th most active metro for first financings nationwide. Other key metros in the list that were among the most active metros in the United States for first financings include: Columbus, Indianapolis, Durham-Chapel Hill, and Denver—which was 12th among metro areas for first financings in 2016-17.
For the relative risers, two of the top ten most active metros for first financings nationally, and six in the top twenty are in this list, including: Seattle, San Diego, Philadelphia, Baltimore, Pittsburgh, and Houston. Four additional cities in the top fifty for first financings nationally include Madison, Raleigh, Ann Arbor, Santa Barbara, and Honolulu.
Collectively, this group of twenty-five metros accounted for just 1.3 percent of the net decline in first financings nationally between 2013-14 and 2016-17, yet contributed to 12 percent of the net gain in first financings between 2009-10 and 2013-14. In other words, they were a key factor in the growth of first financings earlier on, and although they have contributed to the recent decline, they have done so rather modestly. They account for 18 percent of first financings in the United States in the current period (2016-17).
Where Startup Capital Is Reversing
Next let’s look at where startup activity is reversing. This group of metros had strong growth in first financings between the first two periods (2009-10 to 2013-14) followed by a sharp contraction between the second two periods (2013-14 to 2016-17). Because many metro areas met these criteria, a number of filters were applied to reduce this to a manageable list (the entire set of data tables is available for download in the Appendix).
The focus here is on medium-activity metros—those outside the top twenty metros for first financings in 2013-14 (which we’ll look at next) but within the top eighty metros—with sharp declines (in excess of two times the national decline). The data here are sorted by contribution to the decline in total deals nationally (a function of size and rate of decline).
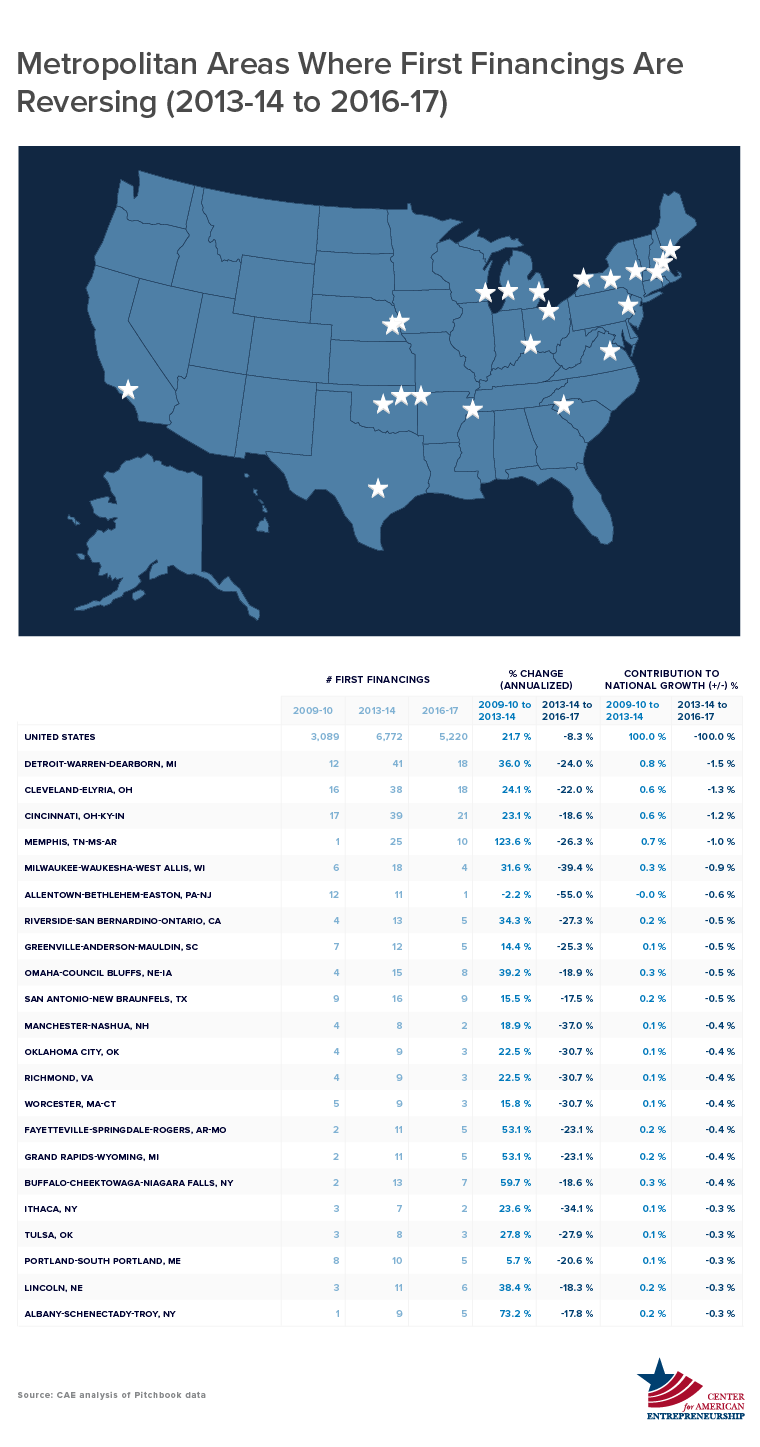
A couple of insights jump out. To begin with, three major Rustbelt cities are at the top of the list—Detroit, Cleveland, and Cincinnati. Others Rustbelt metropolitan areas in the list include Ithaca, Milwaukee, Allentown, Albany, Grand Rapids, and Buffalo.
By far the biggest reversal between the two periods was Memphis, followed distantly by Buffalo, Grand Rapids, Fayetteville, and Milwaukee in one cluster, and then Riverside, Detroit, Omaha, Manchester, and Lincoln a bit further down.
Nine metro areas—Manchester, Ithaca, Oklahoma City, Richmond, Worcester, Milwaukee, Allentown, Greenville, and Portland—had fewer first financings in 2016-17 compared with seven years earlier in 2009-10.
Concentration at the Top Continues
Next, let’s take a look at the behavior of the metro areas with the largest number of first financings—headlined by the well-known startup hubs. In particular, I’ll examine how the leading startup hubs performed over the period of expansion and contraction, and how concentrated the early-stage venture capital market in the U.S remains.
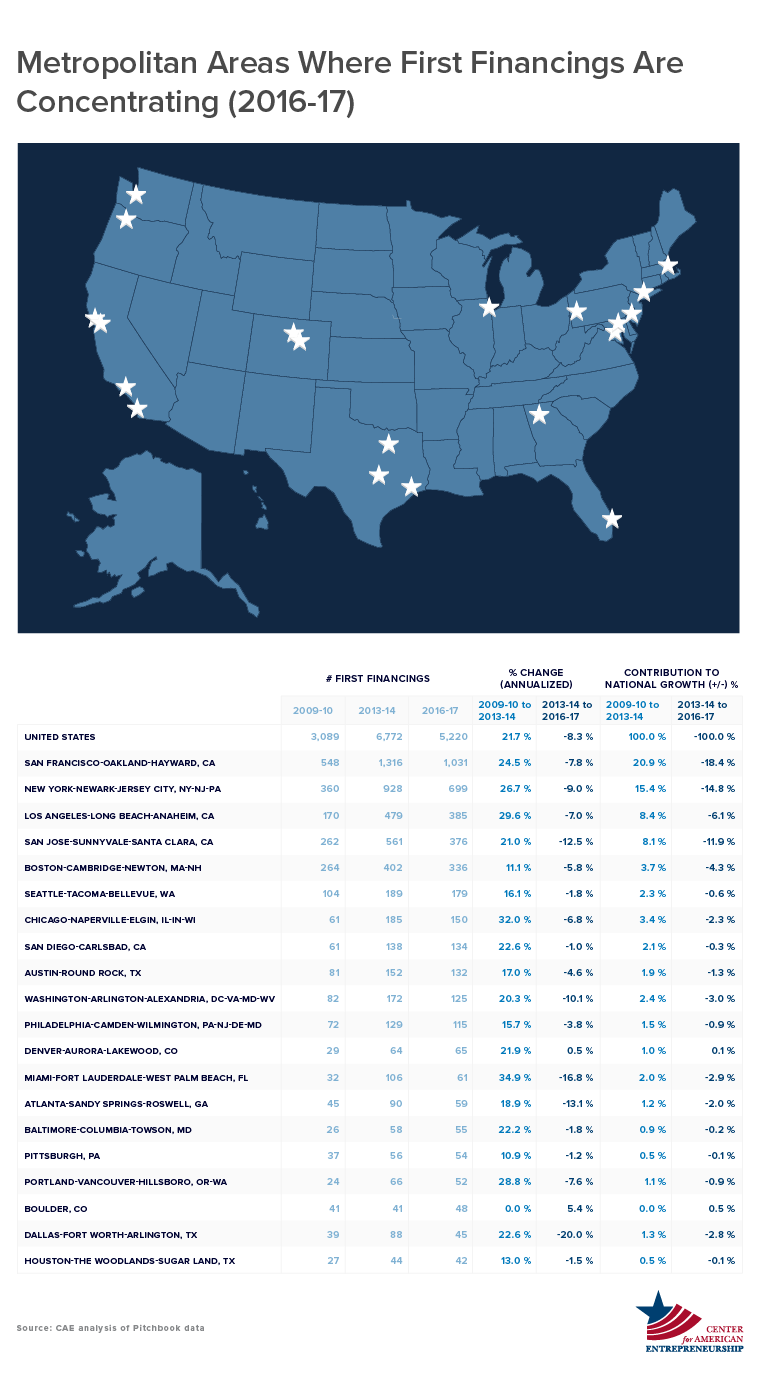
The table sorts metro areas by number of deals in 2016-17. The five most active—San Francisco, New York, Los Angeles, San Jose (Silicon Valley), and Boston—accounted for 54 percent of first financings in 2016-17. For the Top 10 that figure was 68 percent, and for the Top 20, it was 80 percent. Those same figures in 2009-10 were, respectively, 52 percent, 65 percent, and 77 percent—meaning that the leading startup hubs have expanded their share of first financing activity (something I’ll come back to shortly).
In terms of growth, all but one of the twenty metros increased first financings between 2009-10 and 2013-14, and ten of the twenty metros expanded in excess of the U.S. average—lead in percentage terms by Miami, Chicago, Los Angeles, Portland, and New York. On the other end of the spectrum, Philadelphia, Houston, Boston, and Pittsburgh grew the least, while the number of first financings in Boulder was unchanged.
During the period of national contraction from 2013-14 to 2016-17, fourteen of the twenty metros either grew or declined less than the national average. Boulder and Denver both expanded the number of first financings during this period, followed by slight declines in San Diego, Pittsburgh, and Houston. The largest reversals in first financings occurred in Dallas, Miami, Atlanta, San Jose, and Washington.
Even so, all twenty of these metros had more first financings in 2016-17 than in 2009-10. As a group, these metros had 75 percent more first financings at the end (2016-17) than the beginning (2009-10). Compare that to the rest of the U.S., which grew just 49 percent over the same period of time. That is why the market for U.S. first financings has become slightly more concentrated, as the chart below shows.
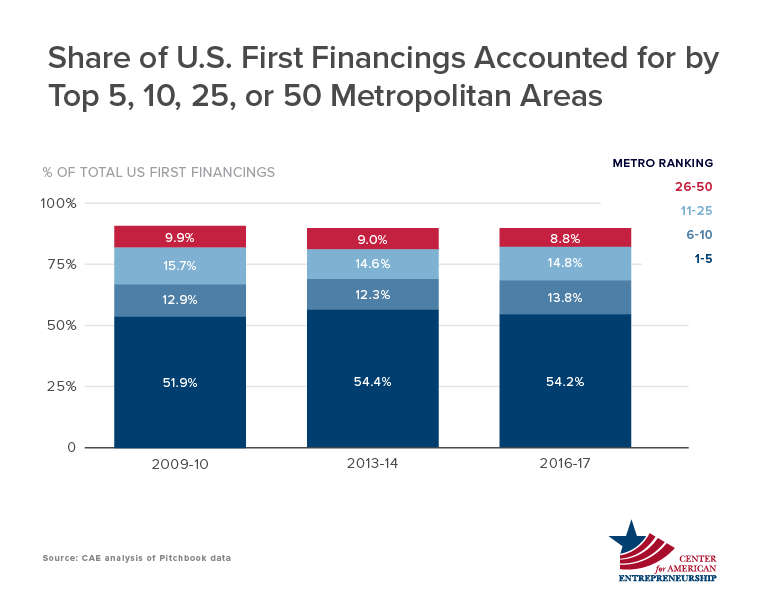
Three key insights jump out. First, the amount of first financings going to the Top 50 was collectively higher in the latest period (2016-17) than in the previous two (2009-10 and 2013-14)—raising from 90.5 percent of total first financings in 2009-10 to 91.6 percent in 2016-17. The first financing market is increasingly concentrated geographically at the top.
Second, the drivers within this group have changed over time. At first, it was the Top 5 driving concentration. In the second period, it was the 6-10 group that drove change. The former group includes San Francisco, New York, Los Angeles, San Jose, and Boston. The latter group includes Seattle, Chicago, San Diego, Austin, and Washington. Among the Top 5, Los Angeles showed the biggest expansion overall. Within the Top 6-10, it was Chicago and San Diego.
Finally, it’s clear that separating the Top 50 from the rest may not be the appropriate cutoff, because change among the fifty most active metros has been driven only by the Top 10. So, while The Rest were rising, the very top cities have been rising even more. Said differently, a rising tide is lifting more boats, but it’s lifting the biggest boats more.
A Silver Lining in the Longer Arc
Finally, it’s important to take a step back and look at the longer-term picture. Historically, it takes decades for startup hubs to emerge. Progress is typically slow and nonlinear. Drawing broad conclusions about the health of American entrepreneurship from the observation of just a few years of data produces a view that is too narrow.
But even in the current cycle, which I suggest began after the Great Recession in 2009, there is evidence that things may be moving closer to a steady-state of early-stage venture deal activity that is substantively higher than in the past. Consider the following.
The chart here shows the actual number of first financings each year from 2009 to 2017 (blue line) and an “alternative” series that fictitiously demonstrates what the number of first financings would have been had the first-financing share of total deals in 2009 been constant in subsequent years. It’s not possible to responsibly take this series further back for reasons of data availability, but an exploration of a few sources leaves me reasonably confident that 2009 is a useful benchmark for such an exercise.
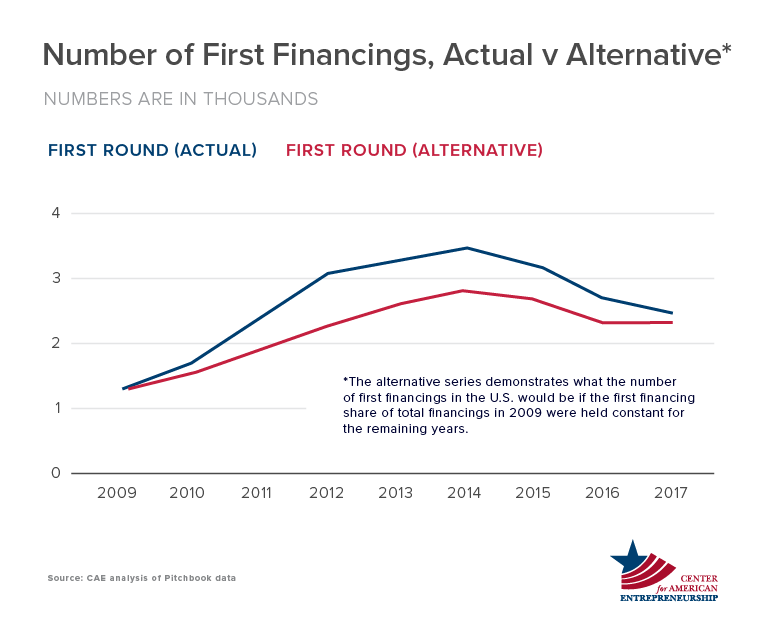
The data suggest that the number of first financings was probably a bit overheated a few years after the Great Recession (which ended in 2009) as the U.S. economy pulled itself out of a deep slump—at least when compared with the historical relationship with total venture deal activity. While not the primary focus of this post, I believe this was caused by factors on both the supply-side (investors) and demand-side (startups) of the venture market, and the expansion had both short-term (cyclical) and long-term (structural) elements.
By 2017, the first financing market returned to levels that are what I would deem as more sustainable given the relationship with the broader venture market. Given that, it appears the “new normal” for first financings is almost certainly higher than what it was in 2009, yet less than what it was in 2014—likely in the neighborhood of where activity is today (however, early data in 2018 indicate a first financing market that is still moving down).
Second, and less speculatively, many metro areas today are seeing more companies secure a first financing than in the longer-term past. Of the 347 metros analyzed:
- 133 metros (or 38 percent) had more activity in 2016-17 than in 2009-10;
- 25 metros (or 7 percent) had the same number of deals in both periods; and
- 56 metros (or 16 percent) had fewer first financings in 2016-17 compared with seven years earlier in 2009-10.
- (the remaining metros had no deals in both the beginning and end points)
That longer-term view is probably a better gauge on where the first financing market is heading than are the ups-and-downs that occurred in the middle of the eight years.
Conclusion
So, are startup hubs rising in America? Yes and no. The results are mixed, with layers of nuance, and plenty of reasons for both optimism or pessimism.
On the one hand, there has been a sharp reduction in first financings in the U.S. since 2014, after what had been a rapid period of growth in the five previous years following the Great Recession. That contraction has been widespread geographically—reaching many U.S. metropolitan areas and further concentrating deals in a small number of cities. This contraction also doesn’t appear to have bottomed-out as of yet.
On the other hand, when zooming out to a more appropriate timeline, first financings are markedly up from where they were a decade ago. There may still be room for first financings to come down, but it seems like we’re approaching a new normal that will see more companies in more cities enter the venture-backed pipeline. The question of how many more remains unsettled, but it’s certainly a larger number.
Moreover, we’re talking about fluctuations over a short period of time—we’ll need to take a longer view before we can determine what the new normal looks like. History suggests that the development of startup hubs should be viewed in terms of decades, not years—it’s simply too soon to say one way or the other if the emergence of new startup hubs is here to stay or how broad-based it will become.
Reasonable people can interpret these data points differently, but I believe the story is a mostly encouraging one—more startups in more cities are accessing venture capital when viewed over a longer time horizon, a period of over-exuberance is moderating, and the early-stage funding market is moving towards a more stable and geographically inclusive path forward. Any number of factors could dampen future growth, and the data at least call into question the scope, pace, and inevitability of a widespread geographic proliferation of startup hubs.
Despite these uncertainties, a number of cities appear to be bucking the trend and could be viewed as potentially having established themselves as legitimate startup hubs. This list includes cities like Boulder, Denver, Durham-Chapel Hill, Madison, Pittsburgh, Columbus, Ann Arbor, and Indianapolis, among others.
Finally, this analysis answers many questions but raises some additional ones—such as whether some of these emerging startup communities are seeing an increase in follow-on rounds of investment or successful exits (e.g. acquisition, IPO); where these within-U.S. patterns fit among the broader global market for startups and venture capital; and the extent to which patterns observed in the last eight years are merely a deviation from longer-term norms or if they are indicative of a new normal in early-stage financing. I look forward to tackling each of these lingering questions in future work.
Author

Ian Hathaway is Research Director at the Center for American Entrepreneurship, where he leads content development efforts, publishes research and commentary, and advises on policy and strategy. He can be followed on Twitter @IanHathaway.
Appendix
- Appendix A: Data Table
-
# of First Financings Share of US First Financings Percent Change in First Financings (annualized) Contribution to Total US Change in First Financings Metropolitan Area 2009-10 2013-14 2016-17 2009-10 2013-14 2016-17 2009-10 to 2013-14 2013-14 to 2016-17 2009-10 to 2013-14 2013-14 to 2016-17 United States 3,089 6,772 5,220 100% 100% 100% 119% -23% 100% -100% Abilene, TX 0 0 1 0.0% 0.0% 0.0% -- -- 0.0% 0.1% Akron, OH 6 6 3 0.2% 0.1% 0.1% 0.0% -20.6% 0.0% -0.2% Albany-Schenectady-Troy, NY 1 9 5 0.0% 0.1% 0.1% 73.2% -17.8% 0.2% -0.3% Albany, OR 0 0 1 0.0% 0.0% 0.0% -- -- 0.0% 0.1% Albuquerque, NM 3 9 6 0.1% 0.1% 0.1% 31.6% -12.6% 0.2% -0.2% Alexandria, LA 1 0 0 0.0% 0.0% 0.0% -100.0% -- 0.0% 0.0% Allentown-Bethlehem-Easton, PA-NJ 12 11 1 0.4% 0.2% 0.0% -2.2% -55.0% 0.0% -0.6% Altoona, PA 0 0 0 0.0% 0.0% 0.0% -- -- 0.0% 0.0% Amarillo, TX 1 1 0 0.0% 0.0% 0.0% 0.0% -100.0% 0.0% -0.1% Ames, IA 0 1 1 0.0% 0.0% 0.0% -- 0.0% 0.0% 0.0% Anchorage, AK 0 3 1 0.0% 0.0% 0.0% -- -30.7% 0.1% -0.1% Ann Arbor, MI 15 25 23 0.5% 0.4% 0.4% 13.6% -2.7% 0.3% -0.1% Anniston-Oxford-Jacksonville, AL 0 0 0 0.0% 0.0% 0.0% -- -- 0.0% 0.0% Appleton, WI 2 1 0 0.1% 0.0% 0.0% -15.9% -100.0% 0.0% -0.1% Asheville, NC 0 3 2 0.0% 0.0% 0.0% -- -12.6% 0.1% -0.1% Athens-Clarke County, GA 2 0 0 0.1% 0.0% 0.0% -100.0% -- -0.1% 0.0% Atlanta-Sandy Springs-Roswell, GA 45 90 59 1.5% 1.3% 1.1% 18.9% -13.1% 1.2% -2.0% Atlantic City-Hammonton, NJ 1 0 0 0.0% 0.0% 0.0% -100.0% -- 0.0% 0.0% Auburn-Opelika, AL 0 0 0 0.0% 0.0% 0.0% -- -- 0.0% 0.0% Augusta-Richmond County, GA-SC 0 1 0 0.0% 0.0% 0.0% -- -100.0% 0.0% -0.1% Austin-Round Rock, TX 81 152 132 2.6% 2.2% 2.5% 17.0% -4.6% 1.9% -1.3% Bakersfield, CA 0 2 1 0.0% 0.0% 0.0% -- -20.6% 0.1% -0.1% Baltimore-Columbia-Towson, MD 26 58 55 0.8% 0.9% 1.1% 22.2% -1.8% 0.9% -0.2% Bangor, ME 2 2 1 0.1% 0.0% 0.0% 0.0% -20.6% 0.0% -0.1% Barnstable Town, MA 1 1 0 0.0% 0.0% 0.0% 0.0% -100.0% 0.0% -0.1% Baton Rouge, LA 3 2 2 0.1% 0.0% 0.0% -9.6% 0.0% 0.0% 0.0% Battle Creek, MI 0 0 1 0.0% 0.0% 0.0% -- -- 0.0% 0.1% Bay City, MI 0 0 0 0.0% 0.0% 0.0% -- -- 0.0% 0.0% Beaumont-Port Arthur, TX 0 0 0 0.0% 0.0% 0.0% -- -- 0.0% 0.0% Bellingham, WA 0 2 3 0.0% 0.0% 0.1% -- 14.5% 0.1% 0.1% Bend-Redmond, OR 2 6 7 0.1% 0.1% 0.1% 31.6% 5.3% 0.1% 0.1% Billings, MT 0 0 0 0.0% 0.0% 0.0% -- -- 0.0% 0.0% Binghamton, NY 0 1 0 0.0% 0.0% 0.0% -- -100.0% 0.0% -0.1% Birmingham-Hoover, AL 5 4 5 0.2% 0.1% 0.1% -5.4% 7.7% 0.0% 0.1% Bismarck, ND 0 0 0 0.0% 0.0% 0.0% -- -- 0.0% 0.0% Blacksburg-Christiansburg-Radford, VA 2 3 2 0.1% 0.0% 0.0% 10.7% -12.6% 0.0% -0.1% Bloomington, IL 0 0 1 0.0% 0.0% 0.0% -- -- 0.0% 0.1% Bloomington, IN 2 1 2 0.1% 0.0% 0.0% -15.9% 26.0% 0.0% 0.1% Bloomsburg-Berwick, PA 3 0 0 0.1% 0.0% 0.0% -100.0% -- -0.1% 0.0% Boise City, ID 1 6 5 0.0% 0.1% 0.1% 56.5% -5.9% 0.1% -0.1% Boston-Cambridge-Newton, MA-NH 264 402 336 8.5% 5.9% 6.4% 11.1% -5.8% 3.7% -4.3% Boulder, CO 41 41 48 1.3% 0.6% 0.9% 0.0% 5.4% 0.0% 0.5% Bowling Green, KY 0 0 2 0.0% 0.0% 0.0% -- -- 0.0% 0.1% Bremerton-Silverdale, WA 0 3 0 0.0% 0.0% 0.0% -- -100.0% 0.1% -0.2% Bridgeport-Stamford-Norwalk, CT 24 27 19 0.8% 0.4% 0.4% 3.0% -11.1% 0.1% -0.5% Brownsville-Harlingen, TX 0 0 0 0.0% 0.0% 0.0% -- -- 0.0% 0.0% Brunswick, GA 0 1 0 0.0% 0.0% 0.0% -- -100.0% 0.0% -0.1% Buffalo-Cheektowaga-Niagara Falls, NY 2 13 7 0.1% 0.2% 0.1% 59.7% -18.6% 0.3% -0.4% Burlington-South Burlington, VT 6 6 3 0.2% 0.1% 0.1% 0.0% -20.6% 0.0% -0.2% Burlington, NC 0 0 0 0.0% 0.0% 0.0% -- -- 0.0% 0.0% California-Lexington Park, MD 0 1 0 0.0% 0.0% 0.0% -- -100.0% 0.0% -0.1% Canton-Massillon, OH 2 0 1 0.1% 0.0% 0.0% -100.0% -- -0.1% 0.1% Cape Coral-Fort Myers, FL 1 2 1 0.0% 0.0% 0.0% 18.9% -20.6% 0.0% -0.1% Carbondale-Marion, IL 0 0 0 0.0% 0.0% 0.0% -- -- 0.0% 0.0% Carson City, NV 2 2 0 0.1% 0.0% 0.0% 0.0% -100.0% 0.0% -0.1% Casper, WY 0 0 0 0.0% 0.0% 0.0% -- -- 0.0% 0.0% Cedar Rapids, IA 0 3 0 0.0% 0.0% 0.0% -- -100.0% 0.1% -0.2% Chambersburg-Waynesboro, PA 0 0 0 0.0% 0.0% 0.0% -- -- 0.0% 0.0% Champaign-Urbana, IL 3 7 6 0.1% 0.1% 0.1% 23.6% -5.0% 0.1% -0.1% Charleston-North Charleston, SC 8 12 9 0.3% 0.2% 0.2% 10.7% -9.1% 0.1% -0.2% Charleston, WV 1 0 0 0.0% 0.0% 0.0% -100.0% -- 0.0% 0.0% Charlotte-Concord-Gastonia, NC-SC 4 14 15 0.1% 0.2% 0.3% 36.8% 2.3% 0.3% 0.1% Charlottesville, VA 2 12 7 0.1% 0.2% 0.1% 56.5% -16.4% 0.3% -0.3% Chattanooga, TN-GA 0 15 9 0.0% 0.2% 0.2% -- -15.7% 0.4% -0.4% Cheyenne, WY 0 1 0 0.0% 0.0% 0.0% -- -100.0% 0.0% -0.1% Chicago-Naperville-Elgin, IL-IN-WI 61 185 150 2.0% 2.7% 2.9% 32.0% -6.8% 3.4% -2.3% Chico, CA 1 1 0 0.0% 0.0% 0.0% 0.0% -100.0% 0.0% -0.1% Cincinnati, OH-KY-IN 17 39 21 0.6% 0.6% 0.4% 23.1% -18.6% 0.6% -1.2% Clarksville, TN-KY 0 0 0 0.0% 0.0% 0.0% -- -- 0.0% 0.0% Cleveland-Elyria, OH 16 38 18 0.5% 0.6% 0.3% 24.1% -22.0% 0.6% -1.3% Coeur d'Alene, ID 0 0 1 0.0% 0.0% 0.0% -- -- 0.0% 0.1% College Station-Bryan, TX 2 3 2 0.1% 0.0% 0.0% 10.7% -12.6% 0.0% -0.1% Colorado Springs, CO 1 3 0 0.0% 0.0% 0.0% 31.6% -100.0% 0.1% -0.2% Columbia, MO 0 3 0 0.0% 0.0% 0.0% -- -100.0% 0.1% -0.2% Columbia, SC 3 4 1 0.1% 0.1% 0.0% 7.5% -37.0% 0.0% -0.2% Columbus, GA-AL 0 0 0 0.0% 0.0% 0.0% -- -- 0.0% 0.0% Columbus, IN 0 0 0 0.0% 0.0% 0.0% -- -- 0.0% 0.0% Columbus, OH 17 27 31 0.6% 0.4% 0.6% 12.3% 4.7% 0.3% 0.3% Corpus Christi, TX 0 0 0 0.0% 0.0% 0.0% -- -- 0.0% 0.0% Corvallis, OR 1 0 0 0.0% 0.0% 0.0% -100.0% -- 0.0% 0.0% Crestview-Fort Walton Beach-Destin, FL 0 1 0 0.0% 0.0% 0.0% -- -100.0% 0.0% -0.1% Cumberland, MD-WV 0 0 0 0.0% 0.0% 0.0% -- -- 0.0% 0.0% Dallas-Fort Worth-Arlington, TX 39 88 45 1.3% 1.3% 0.9% 22.6% -20.0% 1.3% -2.8% Danville, IL 0 0 0 0.0% 0.0% 0.0% -- -- 0.0% 0.0% Daphne-Fairhope-Foley, AL 0 0 0 0.0% 0.0% 0.0% -- -- 0.0% 0.0% Davenport-Moline-Rock Island, IA-IL 0 1 2 0.0% 0.0% 0.0% -- 26.0% 0.0% 0.1% Dayton, OH 5 3 2 0.2% 0.0% 0.0% -12.0% -12.6% -0.1% -0.1% Decatur, AL 0 0 0 0.0% 0.0% 0.0% -- -- 0.0% 0.0% Decatur, IL 0 0 0 0.0% 0.0% 0.0% -- -- 0.0% 0.0% Deltona-Daytona Beach-Ormond Beach, FL 1 2 3 0.0% 0.0% 0.1% 18.9% 14.5% 0.0% 0.1% Denver-Aurora-Lakewood, CO 29 64 65 0.9% 0.9% 1.2% 21.9% 0.5% 1.0% 0.1% Des Moines-West Des Moines, IA 4 4 5 0.1% 0.1% 0.1% 0.0% 7.7% 0.0% 0.1% Detroit-Warren-Dearborn, MI 12 41 18 0.4% 0.6% 0.3% 36.0% -24.0% 0.8% -1.5% Dothan, AL 0 0 0 0.0% 0.0% 0.0% -- -- 0.0% 0.0% Dover, DE 1 5 5 0.0% 0.1% 0.1% 49.5% 0.0% 0.1% 0.0% Duluth, MN-WI 1 0 0 0.0% 0.0% 0.0% -100.0% -- 0.0% 0.0% Durham-Chapel Hill, NC 18 28 29 0.6% 0.4% 0.6% 11.7% 1.2% 0.3% 0.1% East Stroudsburg, PA 0 0 0 0.0% 0.0% 0.0% -- -- 0.0% 0.0% Eau Claire, WI 0 1 0 0.0% 0.0% 0.0% -- -100.0% 0.0% -0.1% El Centro, CA 0 0 0 0.0% 0.0% 0.0% -- -- 0.0% 0.0% El Paso, TX 0 0 0 0.0% 0.0% 0.0% -- -- 0.0% 0.0% Elizabethtown-Fort Knox, KY 0 1 0 0.0% 0.0% 0.0% -- -100.0% 0.0% -0.1% Elkhart-Goshen, IN 0 0 0 0.0% 0.0% 0.0% -- -- 0.0% 0.0% Elmira, NY 0 0 0 0.0% 0.0% 0.0% -- -- 0.0% 0.0% Erie, PA 1 0 1 0.0% 0.0% 0.0% -100.0% -- 0.0% 0.1% Eugene, OR 0 2 2 0.0% 0.0% 0.0% -- 0.0% 0.1% 0.0% Evansville, IN-KY 0 1 1 0.0% 0.0% 0.0% -- 0.0% 0.0% 0.0% Fairbanks, AK 0 0 0 0.0% 0.0% 0.0% -- -- 0.0% 0.0% Fargo, ND-MN 0 1 0 0.0% 0.0% 0.0% -- -100.0% 0.0% -0.1% Fayetteville-Springdale-Rogers, AR-MO 2 11 5 0.1% 0.2% 0.1% 53.1% -23.1% 0.2% -0.4% Flagstaff, AZ 1 0 0 0.0% 0.0% 0.0% -100.0% -- 0.0% 0.0% Flint, MI 0 2 0 0.0% 0.0% 0.0% -- -100.0% 0.1% -0.1% Florence-Muscle Shoals, AL 0 0 0 0.0% 0.0% 0.0% -- -- 0.0% 0.0% Florence, SC 1 0 0 0.0% 0.0% 0.0% -100.0% -- 0.0% 0.0% Fort Collins, CO 4 6 5 0.1% 0.1% 0.1% 10.7% -5.9% 0.1% -0.1% Fort Smith, AR-OK 0 0 0 0.0% 0.0% 0.0% -- -- 0.0% 0.0% Fort Wayne, IN 3 2 1 0.1% 0.0% 0.0% -9.6% -20.6% 0.0% -0.1% Fresno, CA 1 0 1 0.0% 0.0% 0.0% -100.0% -- 0.0% 0.1% Gadsden, AL 0 0 0 0.0% 0.0% 0.0% -- -- 0.0% 0.0% Gainesville, FL 4 8 9 0.1% 0.1% 0.2% 18.9% 4.0% 0.1% 0.1% Gainesville, GA 0 0 0 0.0% 0.0% 0.0% -- -- 0.0% 0.0% Glens Falls, NY 0 0 0 0.0% 0.0% 0.0% -- -- 0.0% 0.0% Grand Forks, ND-MN 0 0 0 0.0% 0.0% 0.0% -- -- 0.0% 0.0% Grand Junction, CO 0 0 0 0.0% 0.0% 0.0% -- -- 0.0% 0.0% Grand Rapids-Wyoming, MI 2 11 5 0.1% 0.2% 0.1% 53.1% -23.1% 0.2% -0.4% Great Falls, MT 0 0 0 0.0% 0.0% 0.0% -- -- 0.0% 0.0% Greeley, CO 0 1 1 0.0% 0.0% 0.0% -- 0.0% 0.0% 0.0% Green Bay, WI 0 0 1 0.0% 0.0% 0.0% -- -- 0.0% 0.1% Greensboro-High Point, NC 1 2 2 0.0% 0.0% 0.0% 18.9% 0.0% 0.0% 0.0% Greenville-Anderson-Mauldin, SC 7 12 5 0.2% 0.2% 0.1% 14.4% -25.3% 0.1% -0.5% Greenville, NC 0 0 1 0.0% 0.0% 0.0% -- -- 0.0% 0.1% Gulfport-Biloxi-Pascagoula, MS 0 0 0 0.0% 0.0% 0.0% -- -- 0.0% 0.0% Hagerstown-Martinsburg, MD-WV 0 0 0 0.0% 0.0% 0.0% -- -- 0.0% 0.0% Hanford-Corcoran, CA 0 0 0 0.0% 0.0% 0.0% -- -- 0.0% 0.0% Harrisburg-Carlisle, PA 1 5 1 0.0% 0.1% 0.0% 49.5% -41.5% 0.1% -0.3% Harrisonburg, VA 0 2 2 0.0% 0.0% 0.0% -- 0.0% 0.1% 0.0% Hartford-West Hartford-East Hartford, CT 5 17 11 0.2% 0.3% 0.2% 35.8% -13.5% 0.3% -0.4% Hattiesburg, MS 0 0 0 0.0% 0.0% 0.0% -- -- 0.0% 0.0% Hickory-Lenoir-Morganton, NC 0 1 0 0.0% 0.0% 0.0% -- -100.0% 0.0% -0.1% Hilton Head Island-Bluffton-Beaufort, SC 0 1 1 0.0% 0.0% 0.0% -- 0.0% 0.0% 0.0% Homosassa Springs, FL 0 0 0 0.0% 0.0% 0.0% -- -- 0.0% 0.0% Hot Springs, AR 0 0 0 0.0% 0.0% 0.0% -- -- 0.0% 0.0% Houma-Thibodaux, LA 0 0 0 0.0% 0.0% 0.0% -- -- 0.0% 0.0% Houston-The Woodlands-Sugar Land, TX 27 44 42 0.9% 0.6% 0.8% 13.0% -1.5% 0.5% -0.1% Huntington-Ashland, WV-KY-OH 1 1 1 0.0% 0.0% 0.0% 0.0% 0.0% 0.0% 0.0% Huntsville, AL 2 1 1 0.1% 0.0% 0.0% -15.9% 0.0% 0.0% 0.0% Idaho Falls, ID 0 1 1 0.0% 0.0% 0.0% -- 0.0% 0.0% 0.0% Indianapolis-Carmel-Anderson, IN 16 32 35 0.5% 0.5% 0.7% 18.9% 3.0% 0.4% 0.2% Iowa City, IA 1 6 5 0.0% 0.1% 0.1% 56.5% -5.9% 0.1% -0.1% Ithaca, NY 3 7 2 0.1% 0.1% 0.0% 23.6% -34.1% 0.1% -0.3% Jackson, MI 0 0 0 0.0% 0.0% 0.0% -- -- 0.0% 0.0% Jackson, MS 2 2 1 0.1% 0.0% 0.0% 0.0% -20.6% 0.0% -0.1% Jacksonville, FL 1 7 7 0.0% 0.1% 0.1% 62.7% 0.0% 0.2% 0.0% Janesville-Beloit, WI 0 1 0 0.0% 0.0% 0.0% -- -100.0% 0.0% -0.1% Jefferson City, MO 0 0 0 0.0% 0.0% 0.0% -- -- 0.0% 0.0% Johnson City, TN 0 0 0 0.0% 0.0% 0.0% -- -- 0.0% 0.0% Johnstown, PA 0 0 1 0.0% 0.0% 0.0% -- -- 0.0% 0.1% Joplin, MO 1 1 0 0.0% 0.0% 0.0% 0.0% -100.0% 0.0% -0.1% Kahului-Wailuku-Lahaina, HI 0 1 0 0.0% 0.0% 0.0% -- -100.0% 0.0% -0.1% Kalamazoo-Portage, MI 4 0 2 0.1% 0.0% 0.0% -100.0% -- -0.1% 0.1% Kansas City, MO-KS 9 24 20 0.3% 0.4% 0.4% 27.8% -5.9% 0.4% -0.3% Kennewick-Richland, WA 0 0 0 0.0% 0.0% 0.0% -- -- 0.0% 0.0% Killeen-Temple, TX 0 0 0 0.0% 0.0% 0.0% -- -- 0.0% 0.0% Kingsport-Bristol-Bristol, TN-VA 0 0 0 0.0% 0.0% 0.0% -- -- 0.0% 0.0% Kingston, NY 0 4 1 0.0% 0.1% 0.0% -- -37.0% 0.1% -0.2% Knoxville, TN 2 6 3 0.1% 0.1% 0.1% 31.6% -20.6% 0.1% -0.2% Kokomo, IN 1 0 0 0.0% 0.0% 0.0% -100.0% -- 0.0% 0.0% Lafayette-West Lafayette, IN 1 5 6 0.0% 0.1% 0.1% 49.5% 6.3% 0.1% 0.1% Lafayette, LA 0 0 0 0.0% 0.0% 0.0% -- -- 0.0% 0.0% Lake Charles, LA 1 0 0 0.0% 0.0% 0.0% -100.0% -- 0.0% 0.0% Lake Havasu City-Kingman, AZ 0 0 0 0.0% 0.0% 0.0% -- -- 0.0% 0.0% Lakeland-Winter Haven, FL 0 0 1 0.0% 0.0% 0.0% -- -- 0.0% 0.1% Lancaster, PA 1 2 2 0.0% 0.0% 0.0% 18.9% 0.0% 0.0% 0.0% Lansing-East Lansing, MI 3 3 0 0.1% 0.0% 0.0% 0.0% -100.0% 0.0% -0.2% Las Cruces, NM 0 1 0 0.0% 0.0% 0.0% -- -100.0% 0.0% -0.1% Las Vegas-Henderson-Paradise, NV 10 28 20 0.3% 0.4% 0.4% 29.4% -10.6% 0.5% -0.5% Lawrence, KS 0 0 1 0.0% 0.0% 0.0% -- -- 0.0% 0.1% Lebanon, PA 0 0 0 0.0% 0.0% 0.0% -- -- 0.0% 0.0% Lewiston-Auburn, ME 0 1 0 0.0% 0.0% 0.0% -- -100.0% 0.0% -0.1% Lexington-Fayette, KY 3 4 5 0.1% 0.1% 0.1% 7.5% 7.7% 0.0% 0.1% Lima, OH 0 0 0 0.0% 0.0% 0.0% -- -- 0.0% 0.0% Lincoln, NE 3 11 6 0.1% 0.2% 0.1% 38.4% -18.3% 0.2% -0.3% Little Rock-North Little Rock-Conway, AR 3 6 2 0.1% 0.1% 0.0% 18.9% -30.7% 0.1% -0.3% Logan, UT-ID 0 0 0 0.0% 0.0% 0.0% -- -- 0.0% 0.0% Longview, WA 0 1 1 0.0% 0.0% 0.0% -- 0.0% 0.0% 0.0% Los Angeles-Long Beach-Anaheim, CA 170 479 385 5.5% 7.1% 7.4% 29.6% -7.0% 8.4% -6.1% Louisville/Jefferson County, KY-IN 10 7 8 0.3% 0.1% 0.2% -8.5% 4.6% -0.1% 0.1% Lubbock, TX 2 1 0 0.1% 0.0% 0.0% -15.9% -100.0% 0.0% -0.1% Lynchburg, VA 0 0 1 0.0% 0.0% 0.0% -- -- 0.0% 0.1% Macon-Bibb County, GA 0 0 0 0.0% 0.0% 0.0% -- -- 0.0% 0.0% Madera, CA 0 0 0 0.0% 0.0% 0.0% -- -- 0.0% 0.0% Madison, WI 11 26 26 0.4% 0.4% 0.5% 24.0% 0.0% 0.4% 0.0% Manchester-Nashua, NH 4 8 2 0.1% 0.1% 0.0% 18.9% -37.0% 0.1% -0.4% Manhattan, KS 0 0 0 0.0% 0.0% 0.0% -- -- 0.0% 0.0% Mankato-North Mankato, MN 0 0 0 0.0% 0.0% 0.0% -- -- 0.0% 0.0% Mansfield, OH 0 0 0 0.0% 0.0% 0.0% -- -- 0.0% 0.0% McAllen-Edinburg-Mission, TX 1 2 0 0.0% 0.0% 0.0% 18.9% -100.0% 0.0% -0.1% Medford, OR 0 0 0 0.0% 0.0% 0.0% -- -- 0.0% 0.0% Memphis, TN-MS-AR 1 25 10 0.0% 0.4% 0.2% 123.6% -26.3% 0.7% -1.0% Merced, CA 0 0 0 0.0% 0.0% 0.0% -- -- 0.0% 0.0% Miami-Fort Lauderdale-West Palm Beach, FL 32 106 61 1.0% 1.6% 1.2% 34.9% -16.8% 2.0% -2.9% Michigan City-La Porte, IN 0 0 0 0.0% 0.0% 0.0% -- -- 0.0% 0.0% Midland, MI 1 0 1 0.0% 0.0% 0.0% -100.0% -- 0.0% 0.1% Midland, TX 0 0 0 0.0% 0.0% 0.0% -- -- 0.0% 0.0% Milwaukee-Waukesha-West Allis, WI 6 18 4 0.2% 0.3% 0.1% 31.6% -39.4% 0.3% -0.9% Minneapolis-St. Paul-Bloomington, MN-WI 32 53 39 1.0% 0.8% 0.7% 13.4% -9.7% 0.6% -0.9% Missoula, MT 1 4 3 0.0% 0.1% 0.1% 41.4% -9.1% 0.1% -0.1% Mobile, AL 0 2 0 0.0% 0.0% 0.0% -- -100.0% 0.1% -0.1% Modesto, CA 1 0 1 0.0% 0.0% 0.0% -100.0% -- 0.0% 0.1% Monroe, LA 0 0 0 0.0% 0.0% 0.0% -- -- 0.0% 0.0% Monroe, MI 0 0 0 0.0% 0.0% 0.0% -- -- 0.0% 0.0% Montgomery, AL 0 0 0 0.0% 0.0% 0.0% -- -- 0.0% 0.0% Morgantown, WV 1 0 1 0.0% 0.0% 0.0% -100.0% -- 0.0% 0.1% Morristown, TN 0 0 0 0.0% 0.0% 0.0% -- -- 0.0% 0.0% Mount Vernon-Anacortes, WA 0 0 0 0.0% 0.0% 0.0% -- -- 0.0% 0.0% Muncie, IN 0 0 0 0.0% 0.0% 0.0% -- -- 0.0% 0.0% Muskegon, MI 0 0 0 0.0% 0.0% 0.0% -- -- 0.0% 0.0% Myrtle Beach-Conway-North Myrtle Beach, SC-NC 0 0 2 0.0% 0.0% 0.0% -- -- 0.0% 0.1% Napa, CA 1 1 0 0.0% 0.0% 0.0% 0.0% -100.0% 0.0% -0.1% Naples-Immokalee-Marco Island, FL 0 2 2 0.0% 0.0% 0.0% -- 0.0% 0.1% 0.0% Nashville-Davidson--Murfreesboro--Franklin, TN 25 62 32 0.8% 0.9% 0.6% 25.5% -19.8% 1.0% -1.9% New Haven-Milford, CT 14 12 16 0.5% 0.2% 0.3% -3.8% 10.1% -0.1% 0.3% New Orleans-Metairie, LA 6 10 11 0.2% 0.1% 0.2% 13.6% 3.2% 0.1% 0.1% New York-Newark-Jersey City, NY-NJ-PA 360 928 699 11.7% 13.7% 13.4% 26.7% -9.0% 15.4% -14.8% Niles-Benton Harbor, MI 0 1 0 0.0% 0.0% 0.0% -- -100.0% 0.0% -0.1% North Port-Sarasota-Bradenton, FL 1 5 2 0.0% 0.1% 0.0% 49.5% -26.3% 0.1% -0.2% Norwich-New London, CT 0 2 1 0.0% 0.0% 0.0% -- -20.6% 0.1% -0.1% Ocala, FL 0 0 0 0.0% 0.0% 0.0% -- -- 0.0% 0.0% Ocean City, NJ 1 0 0 0.0% 0.0% 0.0% -100.0% -- 0.0% 0.0% Odessa, TX 0 0 0 0.0% 0.0% 0.0% -- -- 0.0% 0.0% Ogden-Clearfield, UT 3 4 1 0.1% 0.1% 0.0% 7.5% -37.0% 0.0% -0.2% Oklahoma City, OK 4 9 3 0.1% 0.1% 0.1% 22.5% -30.7% 0.1% -0.4% Olympia-Tumwater, WA 0 1 0 0.0% 0.0% 0.0% -- -100.0% 0.0% -0.1% Omaha-Council Bluffs, NE-IA 4 15 8 0.1% 0.2% 0.2% 39.2% -18.9% 0.3% -0.5% Orlando-Kissimmee-Sanford, FL 10 30 24 0.3% 0.4% 0.5% 31.6% -7.2% 0.5% -0.4% Oshkosh-Neenah, WI 0 2 0 0.0% 0.0% 0.0% -- -100.0% 0.1% -0.1% Owensboro, KY 1 0 1 0.0% 0.0% 0.0% -100.0% -- 0.0% 0.1% Oxnard-Thousand Oaks-Ventura, CA 4 9 9 0.1% 0.1% 0.2% 22.5% 0.0% 0.1% 0.0% Palm Bay-Melbourne-Titusville, FL 1 3 4 0.0% 0.0% 0.1% 31.6% 10.1% 0.1% 0.1% Panama City, FL 0 0 0 0.0% 0.0% 0.0% -- -- 0.0% 0.0% Parkersburg-Vienna, WV 0 1 0 0.0% 0.0% 0.0% -- -100.0% 0.0% -0.1% Pensacola-Ferry Pass-Brent, FL 1 0 1 0.0% 0.0% 0.0% -100.0% -- 0.0% 0.1% Peoria, IL 0 1 1 0.0% 0.0% 0.0% -- 0.0% 0.0% 0.0% Philadelphia-Camden-Wilmington, PA-NJ-DE-MD 72 129 115 2.3% 1.9% 2.2% 15.7% -3.8% 1.5% -0.9% Phoenix-Mesa-Scottsdale, AZ 17 50 36 0.6% 0.7% 0.7% 31.0% -10.4% 0.9% -0.9% Pittsburgh, PA 37 56 54 1.2% 0.8% 1.0% 10.9% -1.2% 0.5% -0.1% Pittsfield, MA 1 2 1 0.0% 0.0% 0.0% 18.9% -20.6% 0.0% -0.1% Port St. Lucie, FL 0 1 0 0.0% 0.0% 0.0% -- -100.0% 0.0% -0.1% Portland-South Portland, ME 8 10 5 0.3% 0.1% 0.1% 5.7% -20.6% 0.1% -0.3% Portland-Vancouver-Hillsboro, OR-WA 24 66 52 0.8% 1.0% 1.0% 28.8% -7.6% 1.1% -0.9% Prescott, AZ 2 0 0 0.1% 0.0% 0.0% -100.0% -- -0.1% 0.0% Providence-Warwick, RI-MA 17 12 14 0.6% 0.2% 0.3% -8.3% 5.3% -0.1% 0.1% Provo-Orem, UT 11 29 18 0.4% 0.4% 0.3% 27.4% -14.7% 0.5% -0.7% Pueblo, CO 1 0 0 0.0% 0.0% 0.0% -100.0% -- 0.0% 0.0% Punta Gorda, FL 0 1 0 0.0% 0.0% 0.0% -- -100.0% 0.0% -0.1% Racine, WI 0 0 0 0.0% 0.0% 0.0% -- -- 0.0% 0.0% Raleigh, NC 15 26 25 0.5% 0.4% 0.5% 14.7% -1.3% 0.3% -0.1% Rapid City, SD 0 0 1 0.0% 0.0% 0.0% -- -- 0.0% 0.1% Reading, PA 2 3 2 0.1% 0.0% 0.0% 10.7% -12.6% 0.0% -0.1% Redding, CA 0 0 0 0.0% 0.0% 0.0% -- -- 0.0% 0.0% Reno, NV 0 5 5 0.0% 0.1% 0.1% -- 0.0% 0.1% 0.0% Richmond, VA 4 9 3 0.1% 0.1% 0.1% 22.5% -30.7% 0.1% -0.4% Riverside-San Bernardino-Ontario, CA 4 13 5 0.1% 0.2% 0.1% 34.3% -27.3% 0.2% -0.5% Roanoke, VA 0 0 0 0.0% 0.0% 0.0% -- -- 0.0% 0.0% Rochester, MN 1 3 1 0.0% 0.0% 0.0% 31.6% -30.7% 0.1% -0.1% Rochester, NY 7 10 7 0.2% 0.1% 0.1% 9.3% -11.2% 0.1% -0.2% Rockford, IL 0 0 0 0.0% 0.0% 0.0% -- -- 0.0% 0.0% Rocky Mount, NC 0 0 0 0.0% 0.0% 0.0% -- -- 0.0% 0.0% Rome, GA 0 0 0 0.0% 0.0% 0.0% -- -- 0.0% 0.0% Sacramento--Roseville--Arden-Arcade, CA 10 19 12 0.3% 0.3% 0.2% 17.4% -14.2% 0.2% -0.5% Saginaw, MI 0 1 0 0.0% 0.0% 0.0% -- -100.0% 0.0% -0.1% Salem, OR 0 0 1 0.0% 0.0% 0.0% -- -- 0.0% 0.1% Salinas, CA 0 1 2 0.0% 0.0% 0.0% -- 26.0% 0.0% 0.1% Salisbury, MD-DE 1 2 5 0.0% 0.0% 0.1% 18.9% 35.7% 0.0% 0.2% Salt Lake City, UT 25 38 27 0.8% 0.6% 0.5% 11.0% -10.8% 0.4% -0.7% San Angelo, TX 0 0 0 0.0% 0.0% 0.0% -- -- 0.0% 0.0% San Antonio-New Braunfels, TX 9 16 9 0.3% 0.2% 0.2% 15.5% -17.5% 0.2% -0.5% San Diego-Carlsbad, CA 61 138 134 2.0% 2.0% 2.6% 22.6% -1.0% 2.1% -0.3% San Francisco-Oakland-Hayward, CA 548 1,316 1,031 17.7% 19.4% 19.8% 24.5% -7.8% 20.9% -18.4% San Jose-Sunnyvale-Santa Clara, CA 262 561 376 8.5% 8.3% 7.2% 21.0% -12.5% 8.1% -11.9% San Luis Obispo-Paso Robles-Arroyo Grande, CA 0 1 4 0.0% 0.0% 0.1% -- 58.7% 0.0% 0.2% Santa Cruz-Watsonville, CA 2 9 8 0.1% 0.1% 0.2% 45.6% -3.9% 0.2% -0.1% Santa Fe, NM 2 1 0 0.1% 0.0% 0.0% -15.9% -100.0% 0.0% -0.1% Santa Maria-Santa Barbara, CA 11 17 15 0.4% 0.3% 0.3% 11.5% -4.1% 0.2% -0.1% Santa Rosa, CA 2 11 8 0.1% 0.2% 0.2% 53.1% -10.1% 0.2% -0.2% Savannah, GA 1 0 1 0.0% 0.0% 0.0% -100.0% -- 0.0% 0.1% Scranton--Wilkes-Barre--Hazleton, PA 0 2 2 0.0% 0.0% 0.0% -- 0.0% 0.1% 0.0% Seattle-Tacoma-Bellevue, WA 104 189 179 3.4% 2.8% 3.4% 16.1% -1.8% 2.3% -0.6% Sebastian-Vero Beach, FL 0 1 0 0.0% 0.0% 0.0% -- -100.0% 0.0% -0.1% Sebring, FL 0 0 0 0.0% 0.0% 0.0% -- -- 0.0% 0.0% Sheboygan, WI 0 1 0 0.0% 0.0% 0.0% -- -100.0% 0.0% -0.1% Sherman-Denison, TX 0 0 0 0.0% 0.0% 0.0% -- -- 0.0% 0.0% Shreveport-Bossier City, LA 1 1 1 0.0% 0.0% 0.0% 0.0% 0.0% 0.0% 0.0% Sioux City, IA-NE-SD 0 0 0 0.0% 0.0% 0.0% -- -- 0.0% 0.0% Sioux Falls, SD 2 3 3 0.1% 0.0% 0.1% 10.7% 0.0% 0.0% 0.0% South Bend-Mishawaka, IN-MI 0 6 2 0.0% 0.1% 0.0% -- -30.7% 0.2% -0.3% Spartanburg, SC 0 0 1 0.0% 0.0% 0.0% -- -- 0.0% 0.1% Spokane-Spokane Valley, WA 1 6 3 0.0% 0.1% 0.1% 56.5% -20.6% 0.1% -0.2% Springfield, IL 0 0 0 0.0% 0.0% 0.0% -- -- 0.0% 0.0% Springfield, MA 1 2 2 0.0% 0.0% 0.0% 18.9% 0.0% 0.0% 0.0% Springfield, MO 1 2 1 0.0% 0.0% 0.0% 18.9% -20.6% 0.0% -0.1% Springfield, OH 0 0 0 0.0% 0.0% 0.0% -- -- 0.0% 0.0% St. Cloud, MN 0 0 0 0.0% 0.0% 0.0% -- -- 0.0% 0.0% St. George, UT 0 0 1 0.0% 0.0% 0.0% -- -- 0.0% 0.1% St. Joseph, MO-KS 0 0 0 0.0% 0.0% 0.0% -- -- 0.0% 0.0% St. Louis, MO-IL 15 39 33 0.5% 0.6% 0.6% 27.0% -5.4% 0.7% -0.4% State College, PA 4 6 0 0.1% 0.1% 0.0% 10.7% -100.0% 0.1% -0.4% Staunton-Waynesboro, VA 0 0 0 0.0% 0.0% 0.0% -- -- 0.0% 0.0% Stockton-Lodi, CA 0 0 1 0.0% 0.0% 0.0% -- -- 0.0% 0.1% Syracuse, NY 0 5 5 0.0% 0.1% 0.1% -- 0.0% 0.1% 0.0% Tallahassee, FL 0 3 1 0.0% 0.0% 0.0% -- -30.7% 0.1% -0.1% Tampa-St. Petersburg-Clearwater, FL 8 23 18 0.3% 0.3% 0.3% 30.2% -7.8% 0.4% -0.3% Terre Haute, IN 1 0 0 0.0% 0.0% 0.0% -100.0% -- 0.0% 0.0% The Villages, FL 1 0 0 0.0% 0.0% 0.0% -100.0% -- 0.0% 0.0% Toledo, OH 3 1 0 0.1% 0.0% 0.0% -24.0% -100.0% -0.1% -0.1% Topeka, KS 0 0 0 0.0% 0.0% 0.0% -- -- 0.0% 0.0% Trenton, NJ 9 5 10 0.3% 0.1% 0.2% -13.7% 26.0% -0.1% 0.3% Tucson, AZ 3 10 6 0.1% 0.1% 0.1% 35.1% -15.7% 0.2% -0.3% Tulsa, OK 3 8 3 0.1% 0.1% 0.1% 27.8% -27.9% 0.1% -0.3% Tuscaloosa, AL 0 0 0 0.0% 0.0% 0.0% -- -- 0.0% 0.0% Tyler, TX 0 0 0 0.0% 0.0% 0.0% -- -- 0.0% 0.0% Urban Honolulu, HI 5 11 10 0.2% 0.2% 0.2% 21.8% -3.1% 0.2% -0.1% Utica-Rome, NY 0 1 0 0.0% 0.0% 0.0% -- -100.0% 0.0% -0.1% Valdosta, GA 0 0 0 0.0% 0.0% 0.0% -- -- 0.0% 0.0% Vallejo-Fairfield, CA 0 0 1 0.0% 0.0% 0.0% -- -- 0.0% 0.1% Victoria, TX 0 0 0 0.0% 0.0% 0.0% -- -- 0.0% 0.0% Virginia Beach-Norfolk-Newport News, VA-NC 0 6 2 0.0% 0.1% 0.0% -- -30.7% 0.2% -0.3% Visalia-Porterville, CA 0 0 0 0.0% 0.0% 0.0% -- -- 0.0% 0.0% Waco, TX 0 0 0 0.0% 0.0% 0.0% -- -- 0.0% 0.0% Walla Walla, WA 0 0 0 0.0% 0.0% 0.0% -- -- 0.0% 0.0% Warner Robins, GA 0 4 10 0.0% 0.1% 0.2% -- 35.7% 0.1% 0.4% Washington-Arlington-Alexandria, DC-VA-MD-WV 82 172 125 2.7% 2.5% 2.4% 20.3% -10.1% 2.4% -3.0% Waterloo-Cedar Falls, IA 0 1 0 0.0% 0.0% 0.0% -- -100.0% 0.0% -0.1% Watertown-Fort Drum, NY 0 0 0 0.0% 0.0% 0.0% -- -- 0.0% 0.0% Wausau, WI 0 0 0 0.0% 0.0% 0.0% -- -- 0.0% 0.0% Wenatchee, WA 0 0 0 0.0% 0.0% 0.0% -- -- 0.0% 0.0% Wichita Falls, TX 0 0 0 0.0% 0.0% 0.0% -- -- 0.0% 0.0% Wichita, KS 1 2 1 0.0% 0.0% 0.0% 18.9% -20.6% 0.0% -0.1% Williamsport, PA 0 0 0 0.0% 0.0% 0.0% -- -- 0.0% 0.0% Wilmington, NC 0 1 1 0.0% 0.0% 0.0% -- 0.0% 0.0% 0.0% Winston-Salem, NC 0 0 3 0.0% 0.0% 0.1% -- -- 0.0% 0.2% Worcester, MA-CT 5 9 3 0.2% 0.1% 0.1% 15.8% -30.7% 0.1% -0.4% Yakima, WA 0 0 1 0.0% 0.0% 0.0% -- -- 0.0% 0.1% York-Hanover, PA 1 0 0 0.0% 0.0% 0.0% -100.0% -- 0.0% 0.0% Youngstown-Warren-Boardman, OH-PA 1 2 1 0.0% 0.0% 0.0% 18.9% -20.6% 0.0% -0.1% Yuba City, CA 0 0 0 0.0% 0.0% 0.0% -- -- 0.0% 0.0% Yuma, AZ 0 0 0 0.0% 0.0% 0.0% -- -- 0.0% 0.0%